Hello Friends, This is Mukesh from Learning Technology. I will tell you in today’s post, Determination of Liquid Limit of Soil in a very easy way.
Contents
Object of Experiment
To determine the liquid limit of a given soil sample.
Standard Reference
IS 2720 (Part-V) – Determination of liquid limit for fine-grained soil.
Equipment
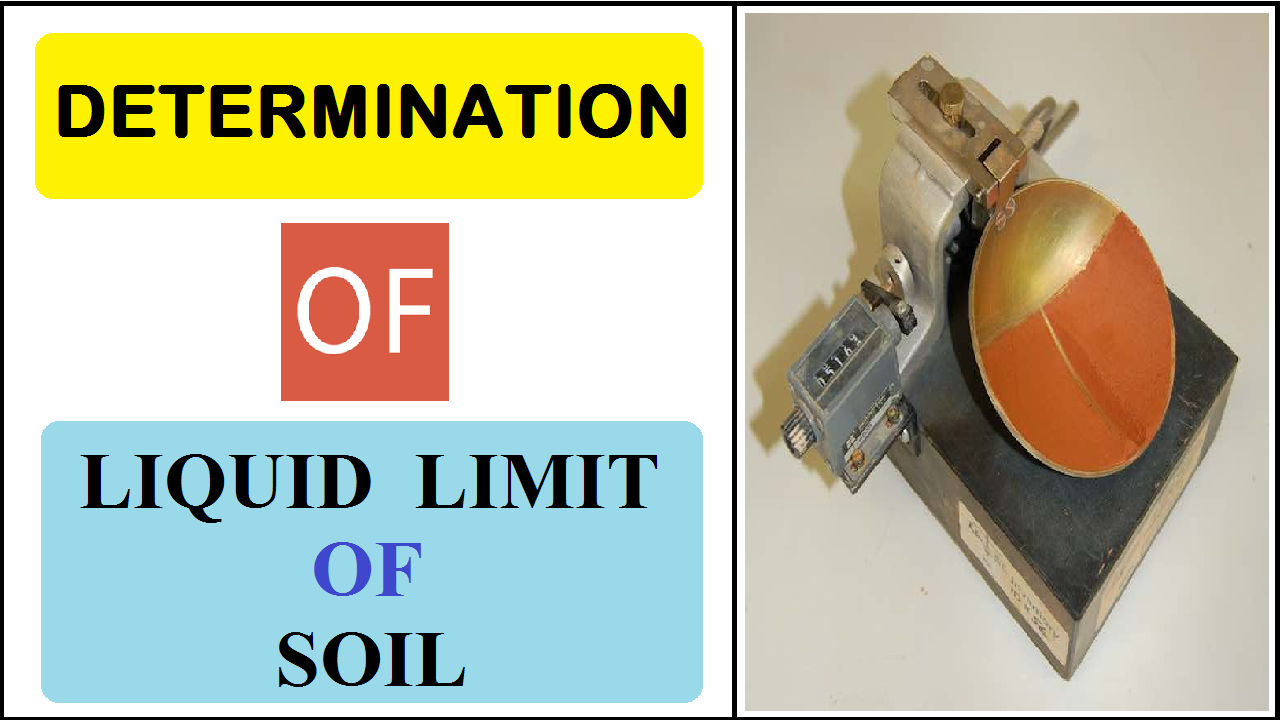
1. Casagrande liquid limit device
2. Grooving tool “a” Casagrande tool and grooving tool “b” (ASTM tool)
3. A flat large glass plate
4. Porcelain evaporating dish
5. Spatula
6. Wash bottle containing distilled water
7. Balances
8. 425-micron sieve
9. Thermostatically controlled oven to maintain the temperature between 105 degree Celsius to 110 degree Celsius
10. Drying cans for water content determination procedure
READ MORE
- Determination of Consolidation Properties of Soil
- Specific Gravity of Soil Soild by Pycnometer
- Determination of Specific Gravity & Water Absorption of Aggregate
- Determination of Specific Gravity of Sand
- Determination of Fineness of Cement by Sieving
- Determination of Initial and Final Setting Time of Cement
Procedure
1. A sample sieved through IS 425 sieve and weighing about 100 grams, is taken on the glass plate and thoroughly mixed with water using the spatula until the mass becomes a thick homogenous paste.
2. A portion of the paste is placed in the cup and leveled parallel to the base up to the maximum depth of 10 mm and a standard groove is made by drawing the grooving tool in single stroke along the symmetrical axis of the cup, holding the tool perpendicular to the cup at the point of the contact. By turning the crank at the rate of two revolutions per second, the cup is lifted and dropped, until the bottom of the groove is closed for a length of 12.5 mm. The number of blows at which this occurs is recorded.
3. About 10 grams of soil from near the closure of the groove are taken for water content determination.
4. By altering the water content of the soil and repeating steps (2 – 3) five water content determinations in the range of ten (10) to fifty (50) blows are made.
5. A Plot of water content against the log of blows is made to draw the flow curve.
6. The liquid limit is read from the flow curve as the water content at twenty-five (25) blows.
Observation table
|
Determination |
1 | 2 | 3 | 4 |
5 |
| No. of blows | |||||
| Container No. | |||||
| Weight of container + Wet soil (gm) | |||||
| Weight of container + dry soil (gm) | |||||
| Weight of dry soil (gm) | |||||
| Water Content (%) | |||||
| Liquid Limit |
Remarks
Write your own experience from the experiment


